> ## Documentation Index
> Fetch the complete documentation index at: https://docs.glood.ai/llms.txt
> Use this file to discover all available pages before exploring further.
# Recommendation Analytics
> Complete guide to understanding recommendation performance metrics and attribution
# Recommendation Analytics
The Glood.AI Recommendation Analytics dashboard provides comprehensive insights into your recommendation engine's performance, helping you understand customer behavior, measure revenue impact, and optimize your recommendation strategies.
 ## Overview
Glood.AI analytics are designed to give you actionable insights into how your AI-powered recommendations are performing. All metrics are calculated at the **session level** using Shopify's native session tracking, ensuring accurate attribution and performance measurement.
All analytics calculations are performed at the session level using Shopify sessions. This ensures accurate tracking of user interactions and purchase attributions within a single shopping journey.
## Key Concepts
### Sessions
A session represents a single visit by a customer to your store. Glood.AI uses Shopify's session tracking to group all customer interactions within a visit, providing accurate attribution of recommendations to purchases.
### Attribution
**Attribution** occurs when a customer interacts with a Glood recommendation and completes a purchase within the same session. Specifically:
* Customer clicks on a product from a Glood recommendation section
* Customer adds a product to cart from a Glood section
* Customer purchases that product within the same session
This session-based attribution ensures that Glood.AI accurately measures its contribution to your store's revenue.
## How Attribution Works
Attribution is how we determine whether a sale should be credited to a Glood recommendation. We deliberately keep this rule **strict** and **conservative** — we'd rather under-report Glood's impact than take credit for a sale we didn't actually influence. The numbers you see in your dashboard reflect revenue Glood is genuinely responsible for.
### The Core Rule
A purchase is attributed to Glood when **all three** of these conditions are met:
The interaction must originate from a Glood-powered section on your storefront (e.g., a "Similar Products," "Frequently Bought Together," or "You May Also Like" widget rendered by Glood). A regular click on a product anywhere else on your store does not count.
Attribution is **product-specific**. The product the customer ultimately buys must be the same product they clicked on from the Glood section. If they click Product A but eventually buy Product B, that purchase is not attributed to Glood — even if both products were shown in a Glood widget.
Both actions — the click on the recommendation and the completed checkout — must occur **within the same Shopify session**. If the session ends before the purchase is completed, attribution does not carry over.
A Shopify session typically lasts for the duration of a single visit. If a customer leaves your store and returns later (after the session has expired), they start a new session — and any prior recommendation clicks are no longer eligible for attribution.
### Why We Keep It Strict
Many analytics platforms use **multi-day attribution windows** (e.g., 7-day, 30-day) where any sale within that window gets credited back to the original click. We intentionally do not do this. Here's why:
* **Honesty over inflation:** A click today and a purchase a week later usually isn't caused by the recommendation — the customer would likely have come back anyway. Crediting Glood for that sale would overstate the real impact.
* **Decision-grade numbers:** When you look at your Glood attribution revenue, you can trust it represents purchases the recommendation engine genuinely influenced — not coincidental sales.
* **Same-session intent is the strongest signal:** If a customer clicks a recommendation and buys that product before leaving the store, the recommendation directly drove the sale. That's the kind of impact worth measuring.
**Expect Glood's attributed revenue to look lower than other tools.** If you compare Glood's numbers side-by-side with other recommendation, upsell, or marketing analytics platforms, our reported revenue will almost always appear smaller — sometimes significantly so. That's by design, not a bug. Most other tools use generous multi-day or even multi-week attribution windows, and many credit themselves for a sale whenever a product was merely *viewed* (not clicked) in their widget. Glood only counts a sale when there's a direct click on a recommendation followed by a purchase of that same product in the same session. Lower numbers here mean **higher confidence** in every dollar reported.
> "Honestly, I didn't trust our old app's numbers. It was showing **56% attribution** — which sounded amazing until I actually checked the orders and realised half of those sales had nothing to do with the recommendations. Glood was sitting at **18%**, and at first I was a bit annoyed. But that 18% was real. Once I started making changes based on Glood's data instead of the inflated stuff, our conversions went up almost right away. Felt good to finally be working with numbers I could actually believe."
>
> — *Glood customer*
### Examples
Here are some concrete scenarios to make this clearer:
**Scenario:** Sarah lands on your store and views a pair of running shoes. Below the product, Glood shows a "You May Also Like" section featuring a running cap. Sarah clicks the cap, adds it to her cart, and checks out — all within the same browsing session.
**Result:** The revenue from the running cap is **attributed to Glood**, because Sarah clicked the cap from a Glood section and purchased that same product before her session ended.
**Scenario:** Raj is browsing a t-shirt page. The Glood "Similar Products" section shows a blue hoodie. Raj clicks the blue hoodie, looks at it, but then decides to buy a **red hoodie** instead (which he found through your store's search bar).
**Result:** The purchase is **not attributed to Glood**. Raj clicked a different product (blue hoodie) from the Glood section than what he ended up buying (red hoodie). Attribution is product-specific.
**Scenario:** Maria visits your store on Monday evening, clicks a candle from a Glood "Frequently Bought Together" widget, but doesn't buy anything. On Tuesday morning, she opens your store again and purchases that same candle.
**Result:** The purchase is **not attributed to Glood**. Maria's Monday session ended before she completed the purchase. Her Tuesday visit is a brand-new session, so the earlier click no longer counts. This is the strict same-session rule in action.
**Scenario:** Liam visits your store, clicks a backpack from a Glood "Trending" section on the homepage, then later in the same session clicks a water bottle from a Glood "Frequently Bought Together" section on the backpack product page. He buys both items in one checkout.
**Result:** **Both products are attributed to Glood.** Each item was clicked from a Glood section and purchased within the same session — attribution applies to each product independently.
**Scenario:** Priya visits your store, navigates directly to a kettle via your main navigation, and purchases it. The kettle did appear in a Glood "Similar Products" widget on another page she scrolled past — but she never clicked on it from there.
**Result:** The purchase is **not attributed to Glood**. A view or impression of the product in a Glood section isn't enough — attribution requires an actual click on the recommendation.
### Attribution at a Glance
| Scenario | Attributed to Glood? |
| ------------------------------------------------------------------------------ | ----------------------------------- |
| Click product in Glood section → buy same product, same session | ✅ Yes |
| Click product in Glood section → buy same product, next day (new session) | ❌ No |
| Click product A in Glood section → buy product B in same session | ❌ No |
| Product shown in Glood section but never clicked → purchased later | ❌ No |
| Click multiple products across Glood sections in one session → buy all of them | ✅ Yes, each attributed individually |
Because attribution is strict and same-session only, the revenue numbers in your Glood dashboard typically represent a **lower bound** on Glood's true influence. The actual lift Glood drives across your store (including delayed purchases, brand recall, and discovery effects) is usually larger than what's reported here — but everything we *do* report, you can trust.
### Data Refresh
Analytics data refreshes periodically to provide you with the most current insights into your recommendation performance.
## Metrics Explained
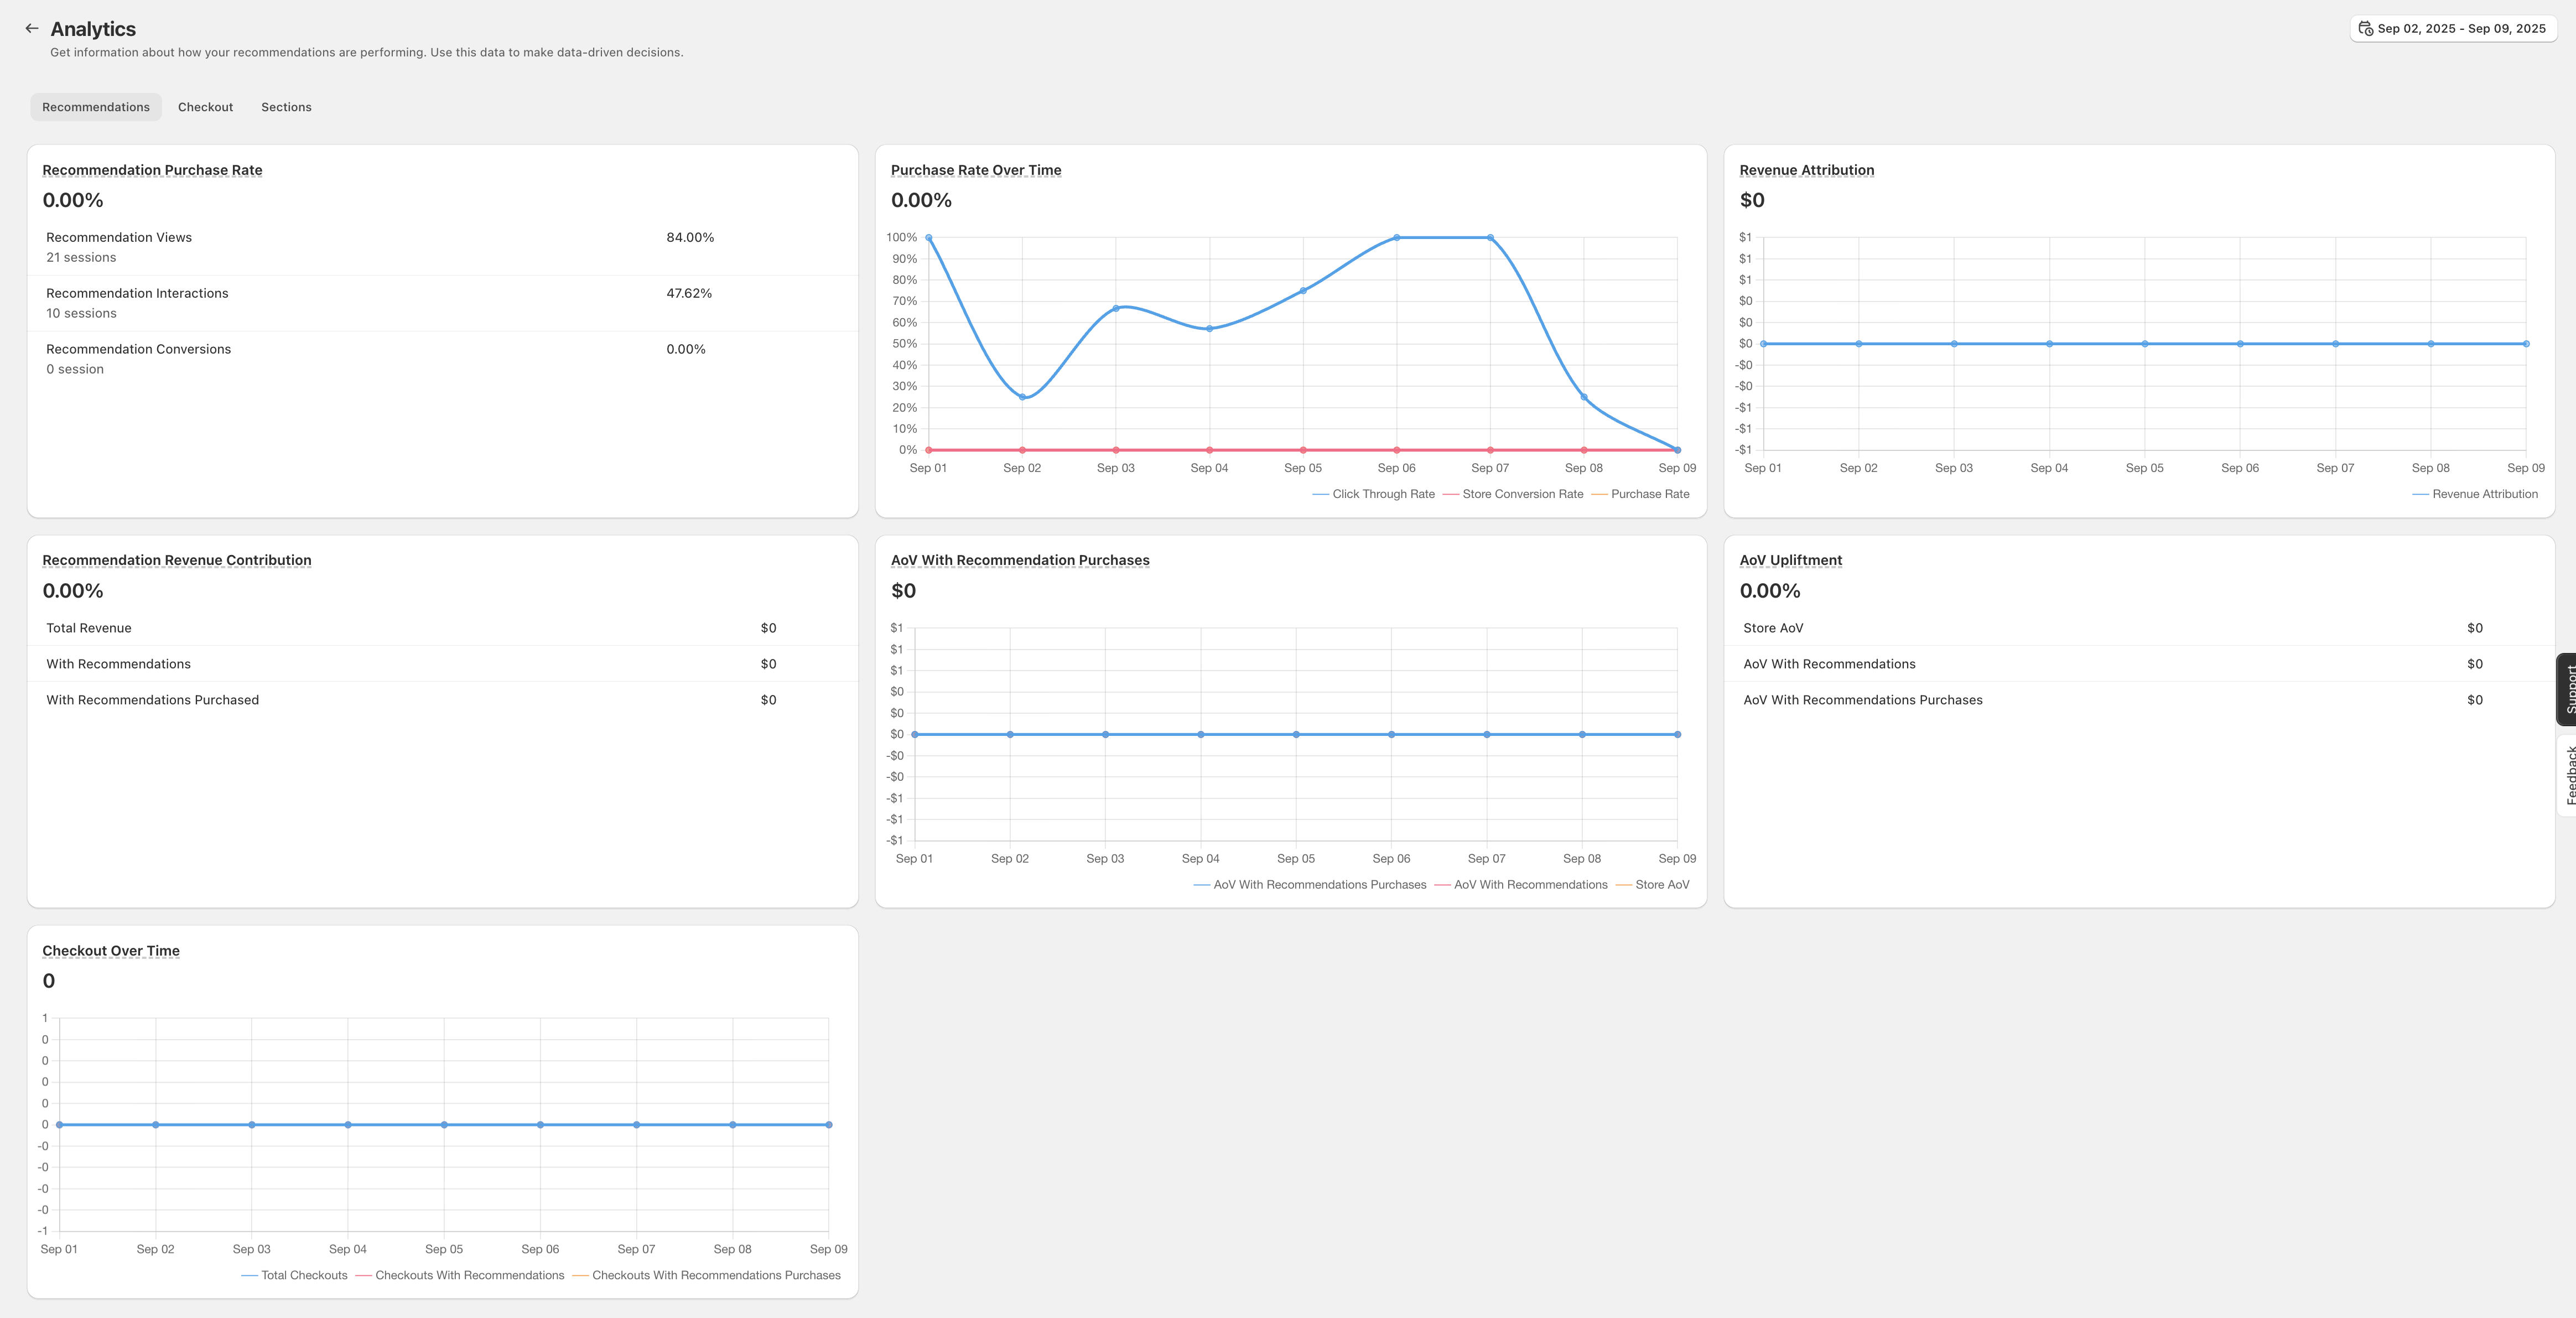
### 1. Recommendation Purchase Rate
The percentage of sessions with Glood recommendations that resulted in a purchase. This metric helps you understand how effectively recommendations are converting browsers into buyers.
**Components:**
* **Recommendation Views**: Total number of sessions where Glood recommendations were displayed
* **Recommendation Interactions**: Sessions where users clicked or engaged with recommendations
* **Recommendation Conversions**: Sessions that resulted in a purchase after recommendation interaction
**How to Improve:**
* Optimize recommendation placement on high-traffic pages
* Test different recommendation types (Similar Products, Frequently Bought Together, etc.)
* Ensure recommendations are relevant to customer context
### 2. Purchase Rate Over Time
This line graph shows the trend of your recommendation purchase rate over time, helping you:
* Identify seasonal patterns
* Measure the impact of optimization efforts
* Track performance consistency
**Graph Elements:**
* **Click Through Rate (Blue Line)**: Shows engagement with recommendations
* **Store Conversion Rate (Green Line)**: Overall store conversion for comparison
* **Purchase Rate (Orange Line)**: Conversion rate for recommendation interactions
### 3. Recommendation Revenue Contribution
Shows the breakdown of revenue sources:
* **Total Revenue**: Overall store revenue
* **With Recommendations**: Revenue from sessions with recommendation interactions
* **With Recommendations Purchased**: Revenue directly attributed to recommendation conversions
This metric helps you understand the financial impact of your recommendation engine.
### 4. Revenue Attribution
The total dollar amount of revenue that can be directly attributed to Glood recommendations. This is calculated when:
1. A customer views or interacts with a Glood recommendation
2. The customer purchases that specific product
3. Both actions occur within the same session
### 5. Average Order Value (AoV) Metrics
Compares the average order value across different customer segments:
* **Store AoV**: Overall average order value for your store
* **AoV With Recommendations**: Average order value for sessions that included recommendation interactions
* **AoV With Recommendations Purchases**: Average order value for purchases directly attributed to recommendations
Higher AoV with recommendations indicates that the AI is successfully encouraging larger basket sizes.
### 6. AoV With Recommendation Purchases Over Time
This time-series graph tracks how recommendation-influenced orders compare to your overall store AoV over time, showing:
* Impact of recommendation strategies on order value
* Effectiveness of upsell and cross-sell recommendations
* Trends in customer purchasing behavior
### 7. AoV Upliftment
The percentage increase in average order value for purchases influenced by recommendations compared to your store average. A positive uplift indicates that recommendations are successfully increasing basket value.
### 8. Checkout Over Time
Monitors the progression of customers through your checkout funnel over time, helping identify:
* Drop-off points in the purchase journey
* Impact of checkout recommendations
* Conversion optimization opportunities
## Understanding the Dashboard Sections
### Recommendations Tab
The primary view showing all recommendation-specific metrics and performance indicators.
### Checkout Tab
Focuses on checkout-related metrics and post-purchase upsell performance.
### Sections Tab
Provides detailed analytics for individual recommendation sections, allowing you to:
* Compare performance across different section types
* Identify top-performing placements
* Optimize underperforming sections
## Best Practices for Using Analytics
### 1. Regular Monitoring
Check your analytics dashboard weekly to:
* Track performance trends
* Identify sudden changes in metrics
* Measure the impact of changes
### 2. A/B Testing
Use analytics to:
* Compare different recommendation strategies
* Test section placements
* Optimize recommendation algorithms
### 3. Seasonal Adjustments
Monitor how metrics change during:
* Holiday seasons
* Sales events
* Product launches
### 4. Revenue Optimization
Focus on metrics that directly impact revenue:
* Revenue Attribution
* AoV Upliftment
* Recommendation Purchase Rate
### 5. Customer Experience
Balance revenue metrics with engagement metrics to ensure recommendations enhance the shopping experience.
## Troubleshooting Common Issues
### Zero or Low Attribution
If you're seeing 0% attribution:
1. Ensure Glood integration is properly configured
2. Verify that recommendation sections are active on key pages
3. Check that tracking pixels are firing correctly
4. Allow sufficient time for data collection (minimum 24-48 hours)
### Inconsistent Metrics
If metrics seem inconsistent:
1. Remember that all calculations are session-based
2. Check for any recent changes to your store setup
3. Verify that all recommendation sections are properly configured
4. Ensure customers can complete purchases within a single session
### Missing Data
If certain metrics aren't updating:
1. Confirm your Glood subscription is active
2. Check for any browser extensions blocking tracking
3. Verify Shopify analytics are functioning correctly
4. Contact support if issues persist
## Optimizing Based on Analytics
### Low Conversion Rate
* Review recommendation relevance
* Test different algorithms (Trending, Similar, Personalized)
* Improve section visibility and placement
### Low AoV
* Implement Frequently Bought Together sections
* Add bundle recommendations
* Include higher-value product suggestions
### Low Engagement
* Enhance visual presentation of recommendations
* Add more recommendation sections to key pages
* Personalize recommendations based on customer behavior
## Advanced Analytics Features
### Export Capabilities
Export your analytics data for:
* Custom reporting
* Integration with BI tools
* Historical analysis
### Custom Date Ranges
Filter analytics by specific time periods to:
* Compare performance across seasons
* Measure campaign effectiveness
* Track improvement over time
### Segment Analysis
Analyze performance by:
* Product categories
* Customer segments
* Traffic sources
## Need Help?
For additional support with analytics:
* Contact our support team at [support@glood.ai](mailto:support@glood.ai)
* Review our [Quick Start Guide](/guides/quick-start/create-first-personalized-recommendations-section)
* Check [How It Works](/how-it-works/introduction) for technical details
Remember, effective use of analytics is key to maximizing the value of your Glood.AI recommendation engine and driving increased revenue for your store.
## Overview
Glood.AI analytics are designed to give you actionable insights into how your AI-powered recommendations are performing. All metrics are calculated at the **session level** using Shopify's native session tracking, ensuring accurate attribution and performance measurement.
All analytics calculations are performed at the session level using Shopify sessions. This ensures accurate tracking of user interactions and purchase attributions within a single shopping journey.
## Key Concepts
### Sessions
A session represents a single visit by a customer to your store. Glood.AI uses Shopify's session tracking to group all customer interactions within a visit, providing accurate attribution of recommendations to purchases.
### Attribution
**Attribution** occurs when a customer interacts with a Glood recommendation and completes a purchase within the same session. Specifically:
* Customer clicks on a product from a Glood recommendation section
* Customer adds a product to cart from a Glood section
* Customer purchases that product within the same session
This session-based attribution ensures that Glood.AI accurately measures its contribution to your store's revenue.
## How Attribution Works
Attribution is how we determine whether a sale should be credited to a Glood recommendation. We deliberately keep this rule **strict** and **conservative** — we'd rather under-report Glood's impact than take credit for a sale we didn't actually influence. The numbers you see in your dashboard reflect revenue Glood is genuinely responsible for.
### The Core Rule
A purchase is attributed to Glood when **all three** of these conditions are met:
The interaction must originate from a Glood-powered section on your storefront (e.g., a "Similar Products," "Frequently Bought Together," or "You May Also Like" widget rendered by Glood). A regular click on a product anywhere else on your store does not count.
Attribution is **product-specific**. The product the customer ultimately buys must be the same product they clicked on from the Glood section. If they click Product A but eventually buy Product B, that purchase is not attributed to Glood — even if both products were shown in a Glood widget.
Both actions — the click on the recommendation and the completed checkout — must occur **within the same Shopify session**. If the session ends before the purchase is completed, attribution does not carry over.
A Shopify session typically lasts for the duration of a single visit. If a customer leaves your store and returns later (after the session has expired), they start a new session — and any prior recommendation clicks are no longer eligible for attribution.
### Why We Keep It Strict
Many analytics platforms use **multi-day attribution windows** (e.g., 7-day, 30-day) where any sale within that window gets credited back to the original click. We intentionally do not do this. Here's why:
* **Honesty over inflation:** A click today and a purchase a week later usually isn't caused by the recommendation — the customer would likely have come back anyway. Crediting Glood for that sale would overstate the real impact.
* **Decision-grade numbers:** When you look at your Glood attribution revenue, you can trust it represents purchases the recommendation engine genuinely influenced — not coincidental sales.
* **Same-session intent is the strongest signal:** If a customer clicks a recommendation and buys that product before leaving the store, the recommendation directly drove the sale. That's the kind of impact worth measuring.
**Expect Glood's attributed revenue to look lower than other tools.** If you compare Glood's numbers side-by-side with other recommendation, upsell, or marketing analytics platforms, our reported revenue will almost always appear smaller — sometimes significantly so. That's by design, not a bug. Most other tools use generous multi-day or even multi-week attribution windows, and many credit themselves for a sale whenever a product was merely *viewed* (not clicked) in their widget. Glood only counts a sale when there's a direct click on a recommendation followed by a purchase of that same product in the same session. Lower numbers here mean **higher confidence** in every dollar reported.
> "Honestly, I didn't trust our old app's numbers. It was showing **56% attribution** — which sounded amazing until I actually checked the orders and realised half of those sales had nothing to do with the recommendations. Glood was sitting at **18%**, and at first I was a bit annoyed. But that 18% was real. Once I started making changes based on Glood's data instead of the inflated stuff, our conversions went up almost right away. Felt good to finally be working with numbers I could actually believe."
>
> — *Glood customer*
### Examples
Here are some concrete scenarios to make this clearer:
**Scenario:** Sarah lands on your store and views a pair of running shoes. Below the product, Glood shows a "You May Also Like" section featuring a running cap. Sarah clicks the cap, adds it to her cart, and checks out — all within the same browsing session.
**Result:** The revenue from the running cap is **attributed to Glood**, because Sarah clicked the cap from a Glood section and purchased that same product before her session ended.
**Scenario:** Raj is browsing a t-shirt page. The Glood "Similar Products" section shows a blue hoodie. Raj clicks the blue hoodie, looks at it, but then decides to buy a **red hoodie** instead (which he found through your store's search bar).
**Result:** The purchase is **not attributed to Glood**. Raj clicked a different product (blue hoodie) from the Glood section than what he ended up buying (red hoodie). Attribution is product-specific.
**Scenario:** Maria visits your store on Monday evening, clicks a candle from a Glood "Frequently Bought Together" widget, but doesn't buy anything. On Tuesday morning, she opens your store again and purchases that same candle.
**Result:** The purchase is **not attributed to Glood**. Maria's Monday session ended before she completed the purchase. Her Tuesday visit is a brand-new session, so the earlier click no longer counts. This is the strict same-session rule in action.
**Scenario:** Liam visits your store, clicks a backpack from a Glood "Trending" section on the homepage, then later in the same session clicks a water bottle from a Glood "Frequently Bought Together" section on the backpack product page. He buys both items in one checkout.
**Result:** **Both products are attributed to Glood.** Each item was clicked from a Glood section and purchased within the same session — attribution applies to each product independently.
**Scenario:** Priya visits your store, navigates directly to a kettle via your main navigation, and purchases it. The kettle did appear in a Glood "Similar Products" widget on another page she scrolled past — but she never clicked on it from there.
**Result:** The purchase is **not attributed to Glood**. A view or impression of the product in a Glood section isn't enough — attribution requires an actual click on the recommendation.
### Attribution at a Glance
| Scenario | Attributed to Glood? |
| ------------------------------------------------------------------------------ | ----------------------------------- |
| Click product in Glood section → buy same product, same session | ✅ Yes |
| Click product in Glood section → buy same product, next day (new session) | ❌ No |
| Click product A in Glood section → buy product B in same session | ❌ No |
| Product shown in Glood section but never clicked → purchased later | ❌ No |
| Click multiple products across Glood sections in one session → buy all of them | ✅ Yes, each attributed individually |
Because attribution is strict and same-session only, the revenue numbers in your Glood dashboard typically represent a **lower bound** on Glood's true influence. The actual lift Glood drives across your store (including delayed purchases, brand recall, and discovery effects) is usually larger than what's reported here — but everything we *do* report, you can trust.
### Data Refresh
Analytics data refreshes periodically to provide you with the most current insights into your recommendation performance.
## Metrics Explained
### 1. Recommendation Purchase Rate
The percentage of sessions with Glood recommendations that resulted in a purchase. This metric helps you understand how effectively recommendations are converting browsers into buyers.
**Components:**
* **Recommendation Views**: Total number of sessions where Glood recommendations were displayed
* **Recommendation Interactions**: Sessions where users clicked or engaged with recommendations
* **Recommendation Conversions**: Sessions that resulted in a purchase after recommendation interaction
**How to Improve:**
* Optimize recommendation placement on high-traffic pages
* Test different recommendation types (Similar Products, Frequently Bought Together, etc.)
* Ensure recommendations are relevant to customer context
### 2. Purchase Rate Over Time
This line graph shows the trend of your recommendation purchase rate over time, helping you:
* Identify seasonal patterns
* Measure the impact of optimization efforts
* Track performance consistency
**Graph Elements:**
* **Click Through Rate (Blue Line)**: Shows engagement with recommendations
* **Store Conversion Rate (Green Line)**: Overall store conversion for comparison
* **Purchase Rate (Orange Line)**: Conversion rate for recommendation interactions
### 3. Recommendation Revenue Contribution
Shows the breakdown of revenue sources:
* **Total Revenue**: Overall store revenue
* **With Recommendations**: Revenue from sessions with recommendation interactions
* **With Recommendations Purchased**: Revenue directly attributed to recommendation conversions
This metric helps you understand the financial impact of your recommendation engine.
### 4. Revenue Attribution
The total dollar amount of revenue that can be directly attributed to Glood recommendations. This is calculated when:
1. A customer views or interacts with a Glood recommendation
2. The customer purchases that specific product
3. Both actions occur within the same session
### 5. Average Order Value (AoV) Metrics
Compares the average order value across different customer segments:
* **Store AoV**: Overall average order value for your store
* **AoV With Recommendations**: Average order value for sessions that included recommendation interactions
* **AoV With Recommendations Purchases**: Average order value for purchases directly attributed to recommendations
Higher AoV with recommendations indicates that the AI is successfully encouraging larger basket sizes.
### 6. AoV With Recommendation Purchases Over Time
This time-series graph tracks how recommendation-influenced orders compare to your overall store AoV over time, showing:
* Impact of recommendation strategies on order value
* Effectiveness of upsell and cross-sell recommendations
* Trends in customer purchasing behavior
### 7. AoV Upliftment
The percentage increase in average order value for purchases influenced by recommendations compared to your store average. A positive uplift indicates that recommendations are successfully increasing basket value.
### 8. Checkout Over Time
Monitors the progression of customers through your checkout funnel over time, helping identify:
* Drop-off points in the purchase journey
* Impact of checkout recommendations
* Conversion optimization opportunities
## Understanding the Dashboard Sections
### Recommendations Tab
The primary view showing all recommendation-specific metrics and performance indicators.
### Checkout Tab
Focuses on checkout-related metrics and post-purchase upsell performance.
### Sections Tab
Provides detailed analytics for individual recommendation sections, allowing you to:
* Compare performance across different section types
* Identify top-performing placements
* Optimize underperforming sections
## Best Practices for Using Analytics
### 1. Regular Monitoring
Check your analytics dashboard weekly to:
* Track performance trends
* Identify sudden changes in metrics
* Measure the impact of changes
### 2. A/B Testing
Use analytics to:
* Compare different recommendation strategies
* Test section placements
* Optimize recommendation algorithms
### 3. Seasonal Adjustments
Monitor how metrics change during:
* Holiday seasons
* Sales events
* Product launches
### 4. Revenue Optimization
Focus on metrics that directly impact revenue:
* Revenue Attribution
* AoV Upliftment
* Recommendation Purchase Rate
### 5. Customer Experience
Balance revenue metrics with engagement metrics to ensure recommendations enhance the shopping experience.
## Troubleshooting Common Issues
### Zero or Low Attribution
If you're seeing 0% attribution:
1. Ensure Glood integration is properly configured
2. Verify that recommendation sections are active on key pages
3. Check that tracking pixels are firing correctly
4. Allow sufficient time for data collection (minimum 24-48 hours)
### Inconsistent Metrics
If metrics seem inconsistent:
1. Remember that all calculations are session-based
2. Check for any recent changes to your store setup
3. Verify that all recommendation sections are properly configured
4. Ensure customers can complete purchases within a single session
### Missing Data
If certain metrics aren't updating:
1. Confirm your Glood subscription is active
2. Check for any browser extensions blocking tracking
3. Verify Shopify analytics are functioning correctly
4. Contact support if issues persist
## Optimizing Based on Analytics
### Low Conversion Rate
* Review recommendation relevance
* Test different algorithms (Trending, Similar, Personalized)
* Improve section visibility and placement
### Low AoV
* Implement Frequently Bought Together sections
* Add bundle recommendations
* Include higher-value product suggestions
### Low Engagement
* Enhance visual presentation of recommendations
* Add more recommendation sections to key pages
* Personalize recommendations based on customer behavior
## Advanced Analytics Features
### Export Capabilities
Export your analytics data for:
* Custom reporting
* Integration with BI tools
* Historical analysis
### Custom Date Ranges
Filter analytics by specific time periods to:
* Compare performance across seasons
* Measure campaign effectiveness
* Track improvement over time
### Segment Analysis
Analyze performance by:
* Product categories
* Customer segments
* Traffic sources
## Need Help?
For additional support with analytics:
* Contact our support team at [support@glood.ai](mailto:support@glood.ai)
* Review our [Quick Start Guide](/guides/quick-start/create-first-personalized-recommendations-section)
* Check [How It Works](/how-it-works/introduction) for technical details
Remember, effective use of analytics is key to maximizing the value of your Glood.AI recommendation engine and driving increased revenue for your store.