Checkout Analytics
The Glood.AI Checkout Analytics dashboard provides detailed insights into your checkout upsell performance, helping you understand conversion rates, revenue impact, and optimize your checkout strategies for maximum effectiveness.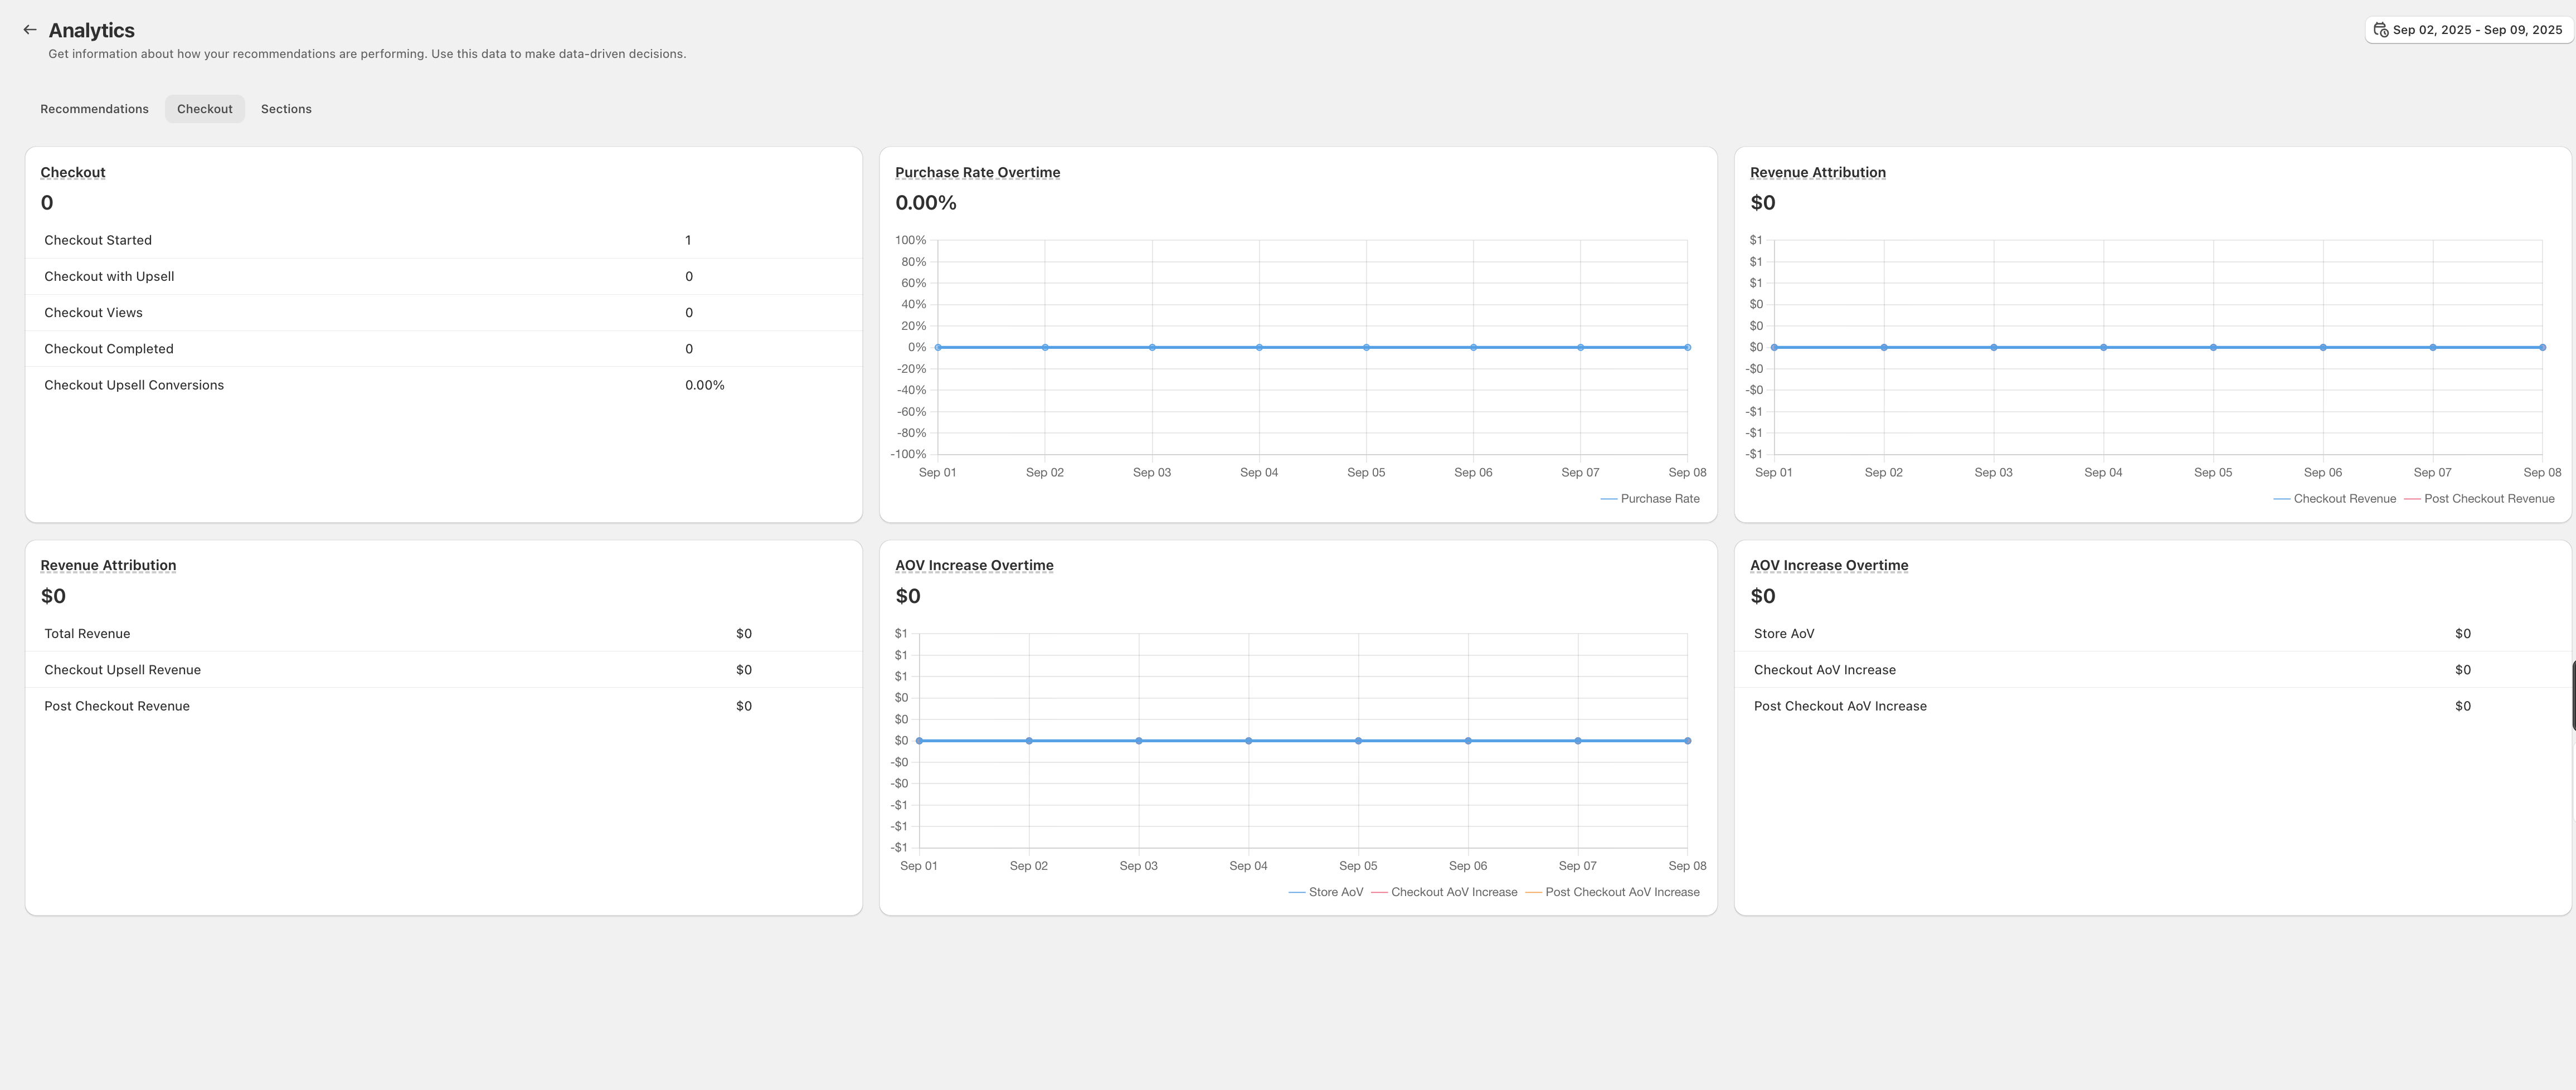
Overview
Checkout Analytics focuses on the critical final stage of the customer journey - the checkout process. These metrics help you understand how effectively your checkout upsells and post-purchase recommendations are performing, all calculated at the session level using Shopify’s native session tracking.All checkout analytics are calculated at the session level using Shopify sessions. This ensures accurate tracking of customer interactions and purchase attributions during the checkout process.
Key Checkout Metrics Explained
1. Checkout Count
The total number of checkout sessions initiated in your store. This baseline metric helps you understand your checkout traffic volume and serves as the foundation for calculating conversion rates. What it tracks:- Every unique checkout session started
- Both completed and abandoned checkouts
- Guest and registered customer checkouts
2. Checkout Started
The number of checkouts that were initiated with Glood checkout upsells active. This metric shows how many customers are exposed to your checkout recommendations. Key insights:- Coverage of checkout upsells across your store
- Opportunity size for checkout optimization
- Baseline for measuring upsell effectiveness
3. Checkout with Upsell
The number of checkout sessions where customers interacted with or viewed Glood upsell recommendations. This measures engagement with your checkout upsells. Indicates:- Customer interest in checkout recommendations
- Visibility and placement effectiveness
- Potential for conversion optimization
4. Checkout Views
Total number of times checkout upsell sections were displayed to customers. Multiple views can occur in a single session if customers navigate back and forth during checkout. Use cases:- Measure exposure frequency
- Identify optimal placement positions
- Track visibility improvements
5. Checkout Completed
The number of successful checkouts that included interaction with Glood checkout upsells. This is your key conversion metric for checkout recommendations. What it measures:- Successful conversions with upsell interaction
- Completion rate effectiveness
- Revenue generation opportunities
6. Checkout Upsell Conversions
The percentage of checkouts with upsell interactions that resulted in completed purchases. This is your primary checkout performance metric. Formula:- Industry average: 2-5%
- Good performance: 5-10%
- Excellent performance: >10%
Time-Based Analytics
Purchase Rate Over Time
This graph visualizes the trend of your checkout conversion rate over time, showing:- Daily, weekly, or monthly conversion patterns
- Impact of seasonal variations
- Effectiveness of optimization efforts
- Upward trends: Improving checkout optimization
- Flat lines: Stable performance, opportunity for testing
- Downward trends: Need for immediate investigation
Revenue Attribution Over Time
Tracks the dollar value of revenue directly attributed to checkout upsells over time:- Daily revenue from checkout upsells
- Cumulative revenue growth
- ROI of checkout optimization efforts
Revenue Metrics
1. Total Revenue
Overall revenue generated across all checkout sessions in the selected period.2. Checkout Upsell Revenue
Revenue directly attributed to products added through checkout upsells. This metric demonstrates the incremental value of your checkout optimization. Attribution criteria:- Product was displayed in checkout upsell
- Customer added product during checkout
- Purchase completed in the same session
3. Post Checkout Revenue
Revenue generated from post-purchase upsells after the initial transaction is complete. Benefits tracked:- Additional revenue without acquisition cost
- Customer lifetime value increase
- Zero-friction upsell opportunities
Average Order Value (AOV) Analysis
1. AOV Increase Overtime
This time-series graph shows how checkout upsells impact your average order value over time. Key metrics displayed:- Store AOV (Blue line): Baseline average order value
- Checkout AOV Increase (Green line): AOV for orders with checkout upsells
- Post Checkout AOV Increase (Orange line): Additional value from post-purchase upsells
2. AOV Increase Overtime Comparison
Comparative analysis showing:- Percentage lift in AOV from checkout upsells
- Trend analysis of AOV improvements
- Seasonal impact on upsell effectiveness
3. Store AOV vs Checkout AOV
Direct comparison between:- Overall store average order value
- Average order value with checkout upsells
- Percentage increase from baseline
4. Checkout AOV Increase
The absolute dollar increase in average order value attributed to checkout upsells. Calculation:5. Post Checkout AOV Increase
Additional revenue per order generated through post-purchase upsells.Optimization Strategies
Improving Checkout Conversions
Low Interaction Rate (< 1%)
Issues to address:- Upsell visibility problems
- Poor product relevance
- Technical implementation issues
- Move upsells higher in checkout flow
- Improve product recommendations algorithm
- A/B test different layouts and designs
Low Conversion Rate (< 2%)
Optimization opportunities:- Refine product selection logic
- Adjust pricing strategies
- Improve urgency messaging
- Simplify add-to-cart process
Below Average AOV Increase (< 10%)
Enhancement strategies:- Recommend higher-value products
- Implement bundle offers
- Create exclusive checkout-only deals
- Add quantity-based discounts
Best Practices for Checkout Analytics
1. Regular Monitoring Schedule
- Daily: Check conversion rates and revenue
- Weekly: Analyze trends and patterns
- Monthly: Deep dive into performance metrics
- Quarterly: Strategic optimization planning
2. A/B Testing Framework
Test these elements systematically:- Upsell placement (top vs. bottom of checkout)
- Number of products shown (1-3 vs. 4-6)
- Product selection algorithms
- Visual presentation styles
- Pricing and discount strategies
3. Segmentation Analysis
Analyze performance by:- Customer segments (new vs. returning)
- Order value tiers
- Product categories
- Device types (mobile vs. desktop)
- Geographic regions
4. Seasonal Adjustments
Optimize for different periods:- Holiday shopping seasons
- Sale events (Black Friday, Cyber Monday)
- Industry-specific peak times
- End-of-season clearances
Common Issues and Troubleshooting
Zero or Low Metrics
No Checkout Views
- Verify checkout upsell sections are enabled
- Check theme compatibility
- Confirm proper installation on checkout pages
- Test with different browsers/devices
No Conversions Despite Views
- Review product relevance algorithms
- Check pricing competitiveness
- Ensure smooth add-to-cart functionality
- Verify inventory availability
Revenue Not Tracking
- Confirm proper attribution setup
- Check Shopify analytics integration
- Verify session tracking is working
- Allow 24-48 hours for data processing
Inconsistent Data
Metrics Don’t Match Shopify
Remember that:- Glood uses session-based attribution
- Only tracks interactions with Glood elements
- May have different attribution windows
- Focuses on incremental revenue
Sudden Drops in Performance
Check for:- Recent theme changes
- Checkout flow modifications
- Payment gateway issues
- Technical errors or conflicts
Advanced Optimization Techniques
1. Dynamic Pricing Strategies
- Time-based discounts during checkout
- Volume-based incentives
- Personalized offers based on cart value
- Limited-time checkout exclusives
2. Smart Product Selection
- Complementary product algorithms
- Frequently bought together patterns
- Inventory-aware recommendations
- Margin-optimized suggestions
3. Post-Purchase Optimization
- Thank you page upsells
- Order confirmation additions
- Email follow-up sequences
- Loyalty program enrollment
4. Mobile Checkout Optimization
- Simplified mobile layouts
- Touch-optimized interfaces
- Faster loading recommendations
- Mobile-specific offers
Integration with Other Metrics
Relationship with Recommendation Analytics
- Pre-checkout recommendation performance
- Cart abandonment recovery
- Cross-sell effectiveness
- Customer journey optimization
Impact on Customer Lifetime Value
- Repeat purchase influence
- Average order frequency
- Customer satisfaction scores
- Long-term revenue impact
Reporting and Export Options
Data Export Capabilities
- CSV export for detailed analysis
- API access for custom reporting
- Integration with BI tools
- Automated report scheduling
Custom Date Ranges
- Hourly analysis for flash sales
- Daily tracking for campaigns
- Weekly business reviews
- Monthly performance reports
- Annual strategic planning
ROI Calculation
Measuring Checkout Upsell ROI
- Glood subscription cost
- Setup and customization time
- Ongoing optimization efforts
- Incremental revenue generated
Success Benchmarks
- Month 1: Establish baseline metrics
- Month 2: Achieve 2% conversion rate
- Month 3: Reach 5% conversion rate
- Month 6: Optimize for 10%+ AOV increase
- Year 1: 3-5x ROI achievement
Need Help?
For additional support with checkout analytics:- Contact our support team at support@glood.ai
- Review our Checkout Upsell Guide
- Explore Post-Checkout Strategies
- Check Recommendation Analytics for full-funnel insights